TLDR
This site uses your ratings in each time control category that you have at least 20 games as inputs to linear regression models in order to estimate a FIDE rating. The models were generated from a data set of about 28,000 users who have listed their FIDE rating on their lichess profile.
Also, if you liked this site and would like to see it get more accurate I would be eternally grateful if you considered donating to the project.
- PayPal: https://paypal.me/UnrealDuck
- Bitcoin: 1Gy8GQhvDBka6Sx1DwFPo1bh9Bs6gbZEEB
-
Venmo: @ethleb

About the Data
I started by downloading the public information of a little over a million lichess users (this took a while) and then created a dataset with only the users who listed a FIDE rating in their profile. Only about 3% of users included a FIDE rating in their profile, so the dataset came out to around 28,000 observations. Before fitting a linear model I removed every data point that had fewer than 50 games played in the time controls that I was using for the explanatory variables. Below is a scatterplot of FIDE rating plotted against blitz rating.
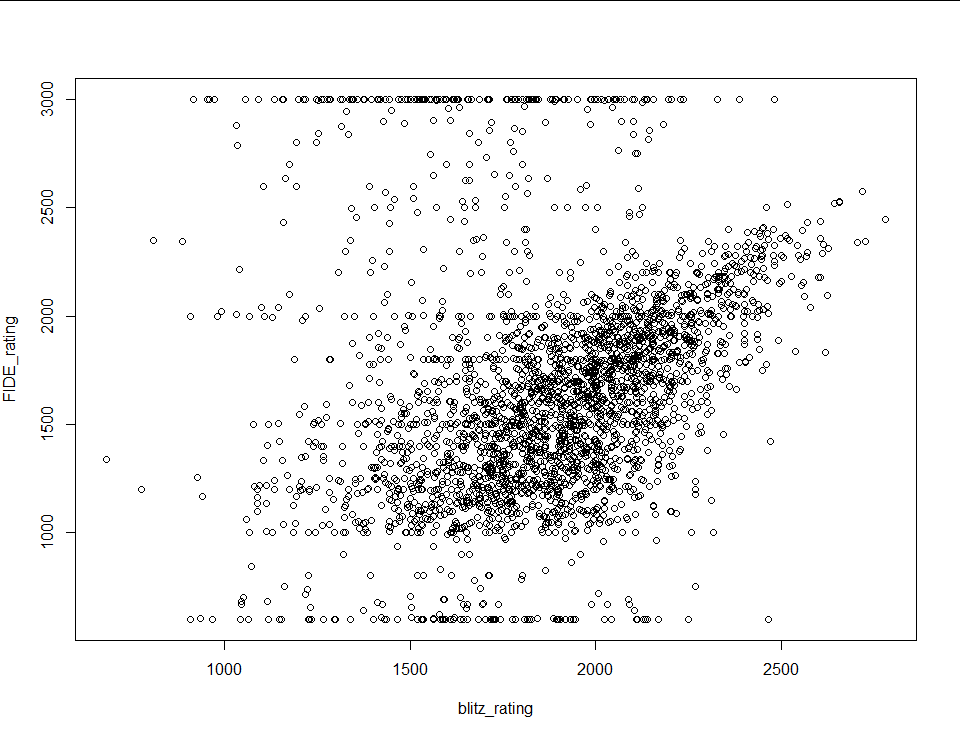
Because the FIDE ratings are self reported it’s a little messy. There is clearly a relationship, but there’s a lot of cleanup that has to be done. First, I removed every data point with a FIDE rating above 2900 (the record is 2882) and below 1000 (because that’s the floor in the FIDE rating system). The plot is already looking better:
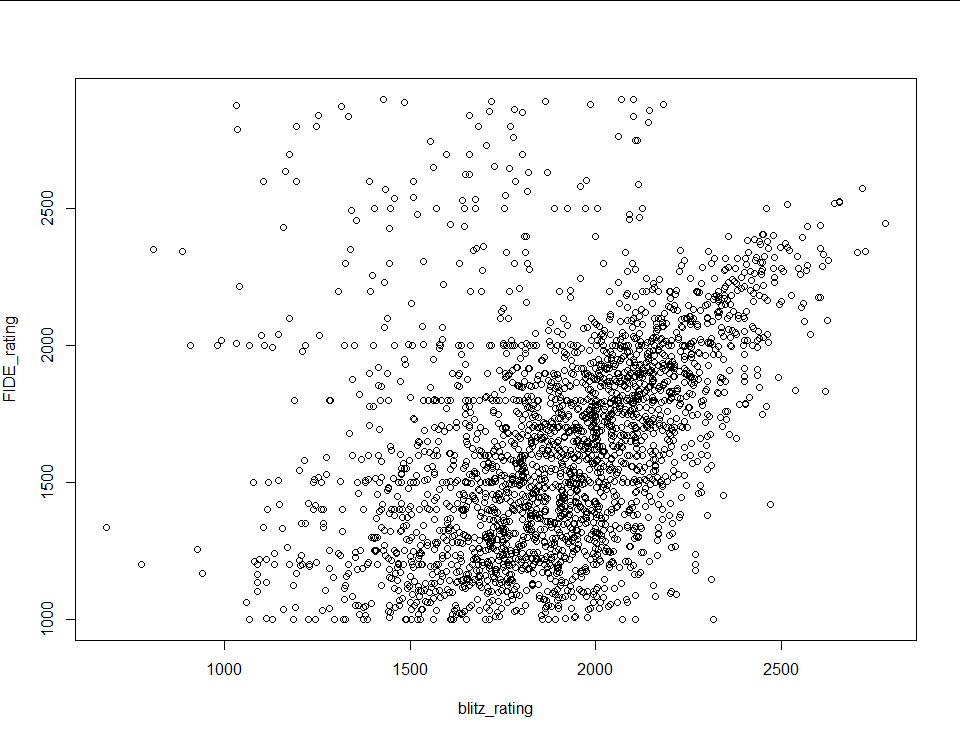
There’s still a lot of noise in the top left, which makes sense because I would expect people to pretend to be stronger players than they are and not weaker than they are. To clean it some more I fit a linear model to the data and removed every point with a residual greater than two standard deviations from the median (chop at red lines):
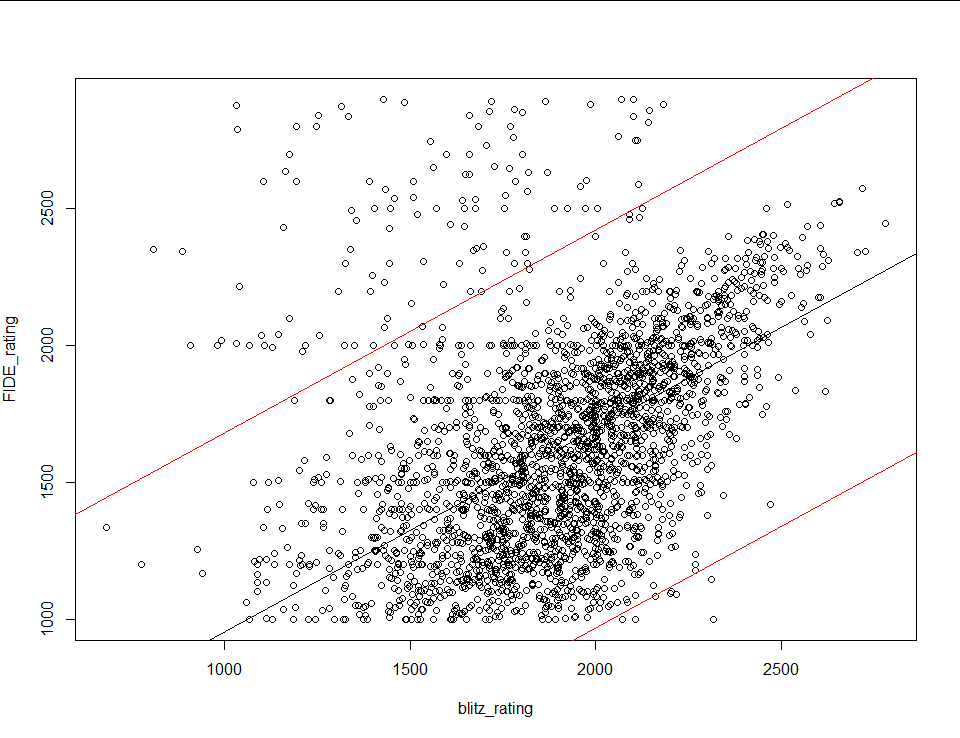
The result looks like this:
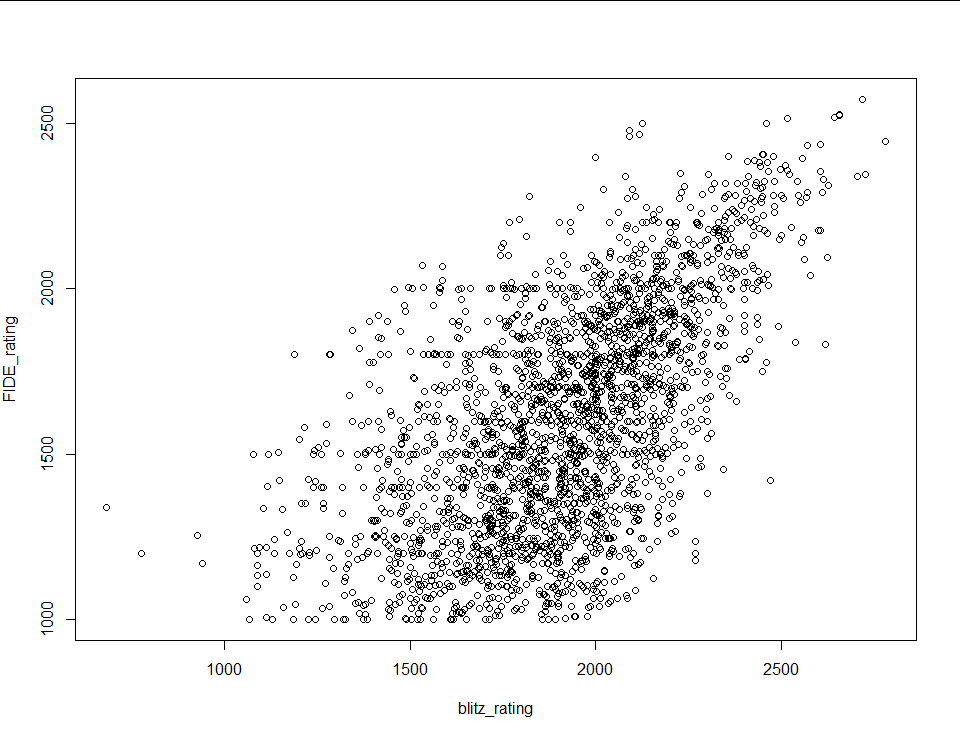
Beautiful. If I were doing this data analysis for interpretive reasons that last step would likely have been me overstepping as an analyst, but all I’m trying to do is create a model with strong predictive power. The final step is to generate a least absolute distance model using r’s rq() function and call it a day.
Unfortunately blitz rating isn’t the only explanatory variable I’m working with. I also have bullet, rapid and classical ratings, and every combination of the four (for a total of 15 models). For the other three single regression models I repeated the steps above. All four resulting scatter plots follow:
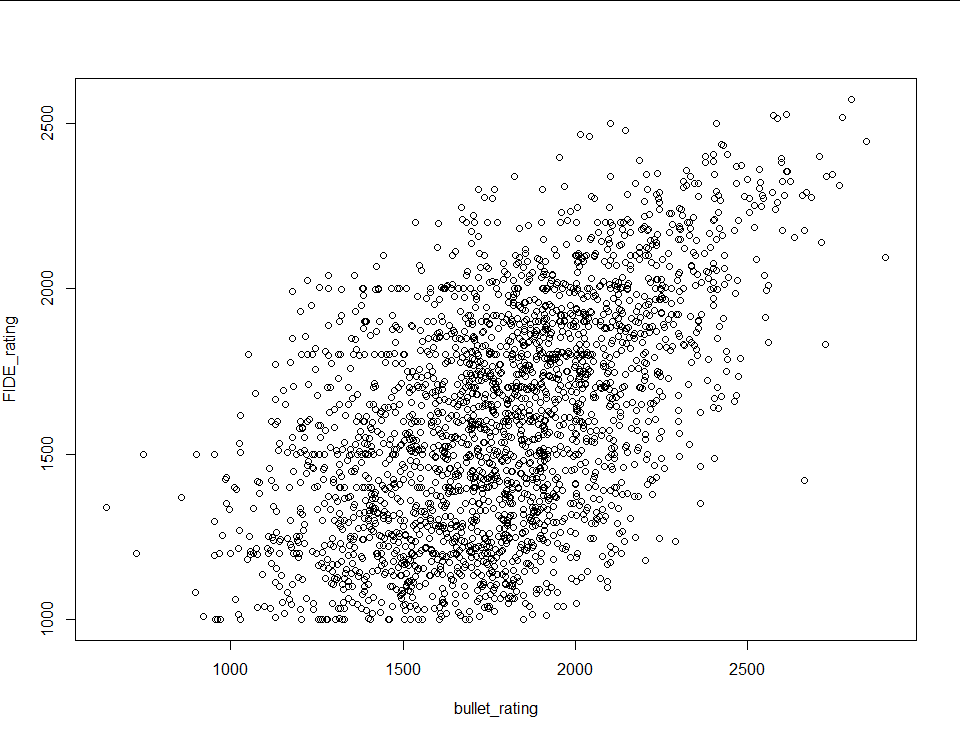 |
|
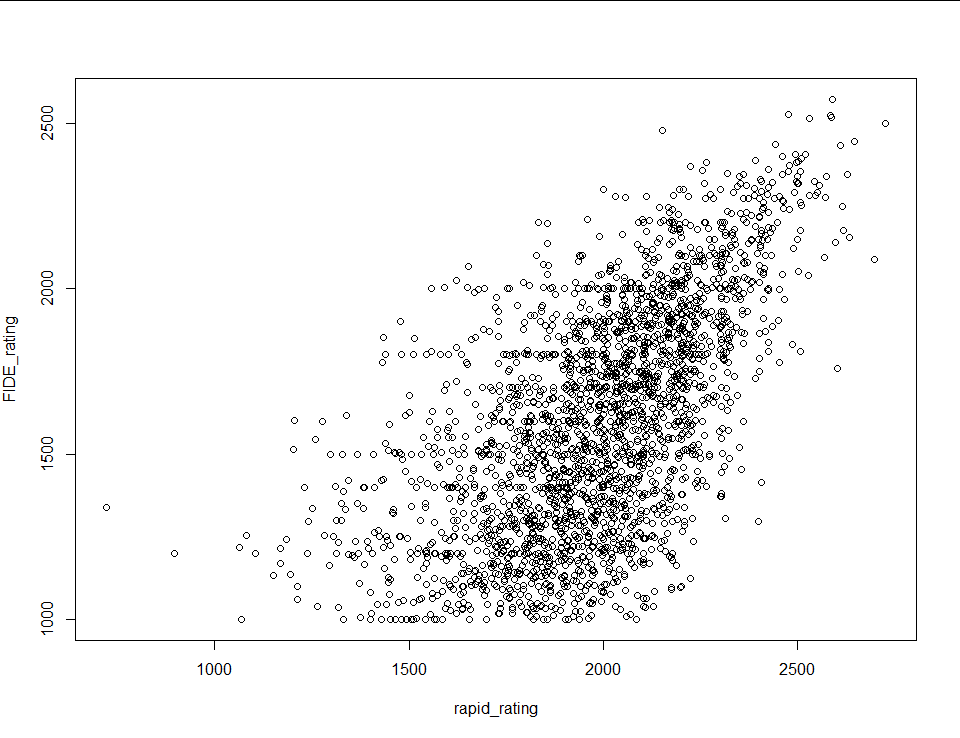 |
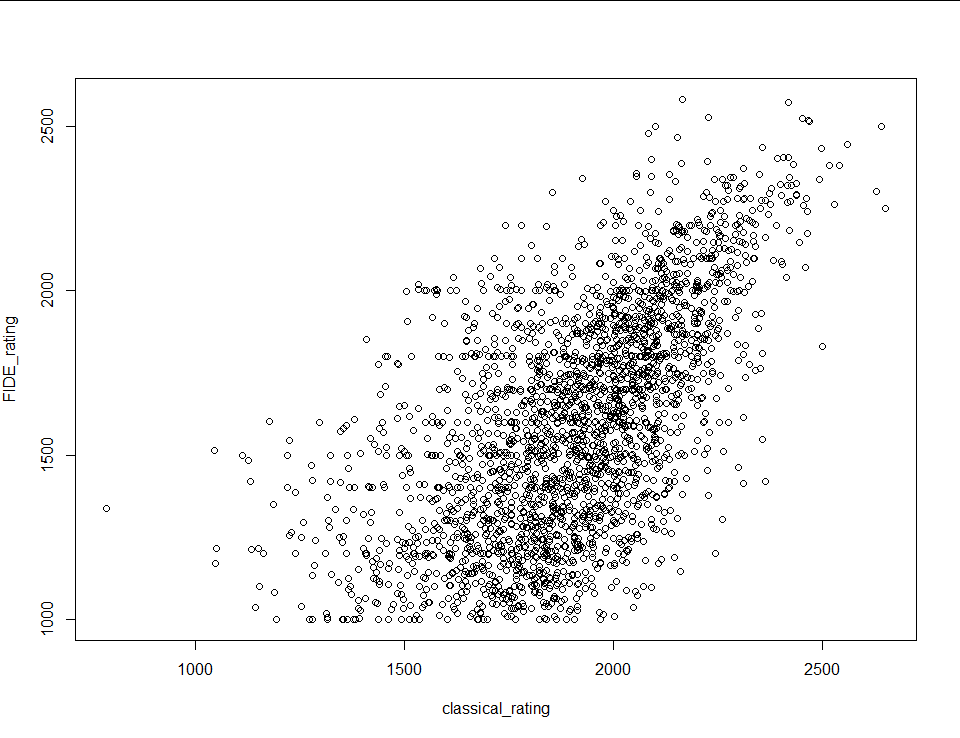 |
The only thing I did differently for the multiple regression models (the models with more than one explanatory variable) was use the r’s step() function to remove redundant variables each time I fit a model. Unfortunately I can’t show the results in a scatterplot, because scatterplots only have two dimensions. The models have a Pearson correlation coefficient of 0.626 at best to 0.538 at worst.
If you have any questions, comments, or words of encouragement feel free to shoot an email to duckunreal@gmail.com